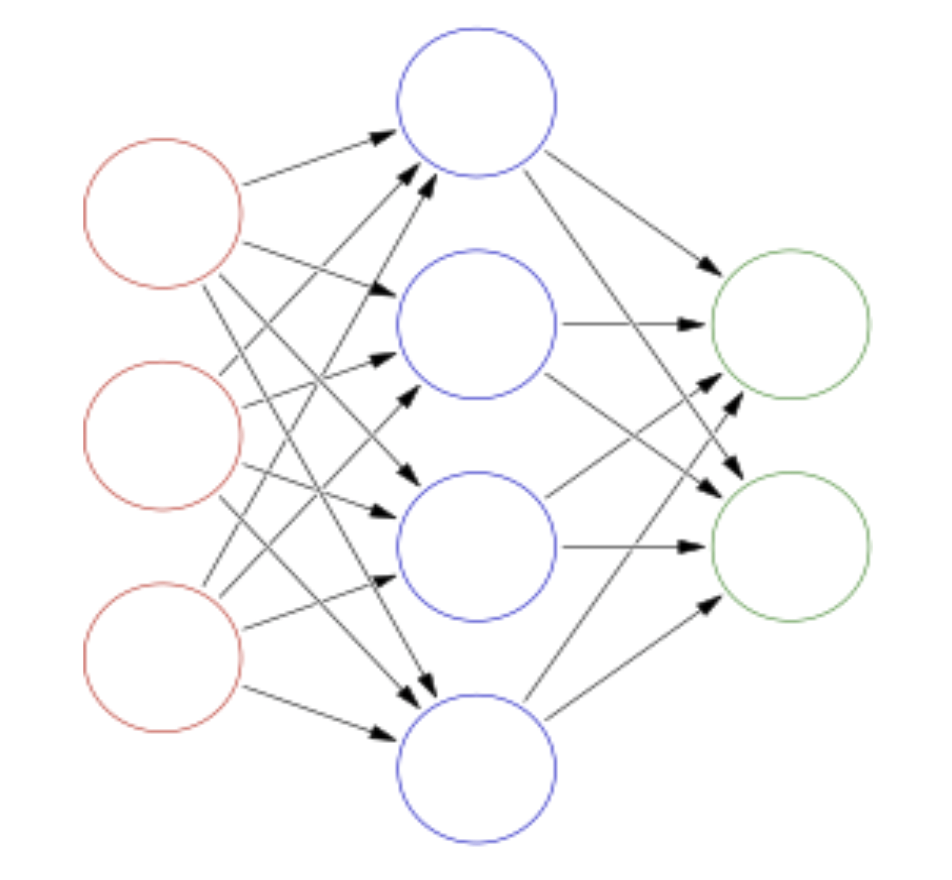
is a library that allows web application developers to create interactive pictorial components.
These components have bi-directional communication allowing applications to integrate them with
other HTML components and create a seamless experience for end users.
Web Applications rule the world. Isn't HTML good enough?
There are a few ways in which a pictorial approach can improve upon and complement (not replace) HTML/text.
Genetic Factors: Cognitive Efficiency, better Memory and Recall
Application Size and Complexity: Compartmentalization of information
from being broken over 10s or 100s of pages, unintuitive, hidden workflows etc.
More Intuitive: Increased emotional impact and happiness for end users
How does a pictorial approach improve things?
A quick way for readers to get a feel for the pictorial approach is to look at a well known application
that they are already familiar with viz. Google Maps.
Examples of Pictorial approach
Below is a visual tour of each of the main characteristics of pictures:
1. Graphical Scenes
2. Viewing Objects in Context
3. Shapes
4. Size
5. Color
Additionally, unlike static paintings or scenes, interactive apps like Google Maps and
1000words.js also have the following features:
6. Sense of motion (zoom & pan) _ Interactivity _ Increasing detail revealed as user zooms in and vice-versa
7. Drilldown
Only 1000words.js apps have the following additional features: 8. Interconnected Views 9. Programmatic Zoom and Pan
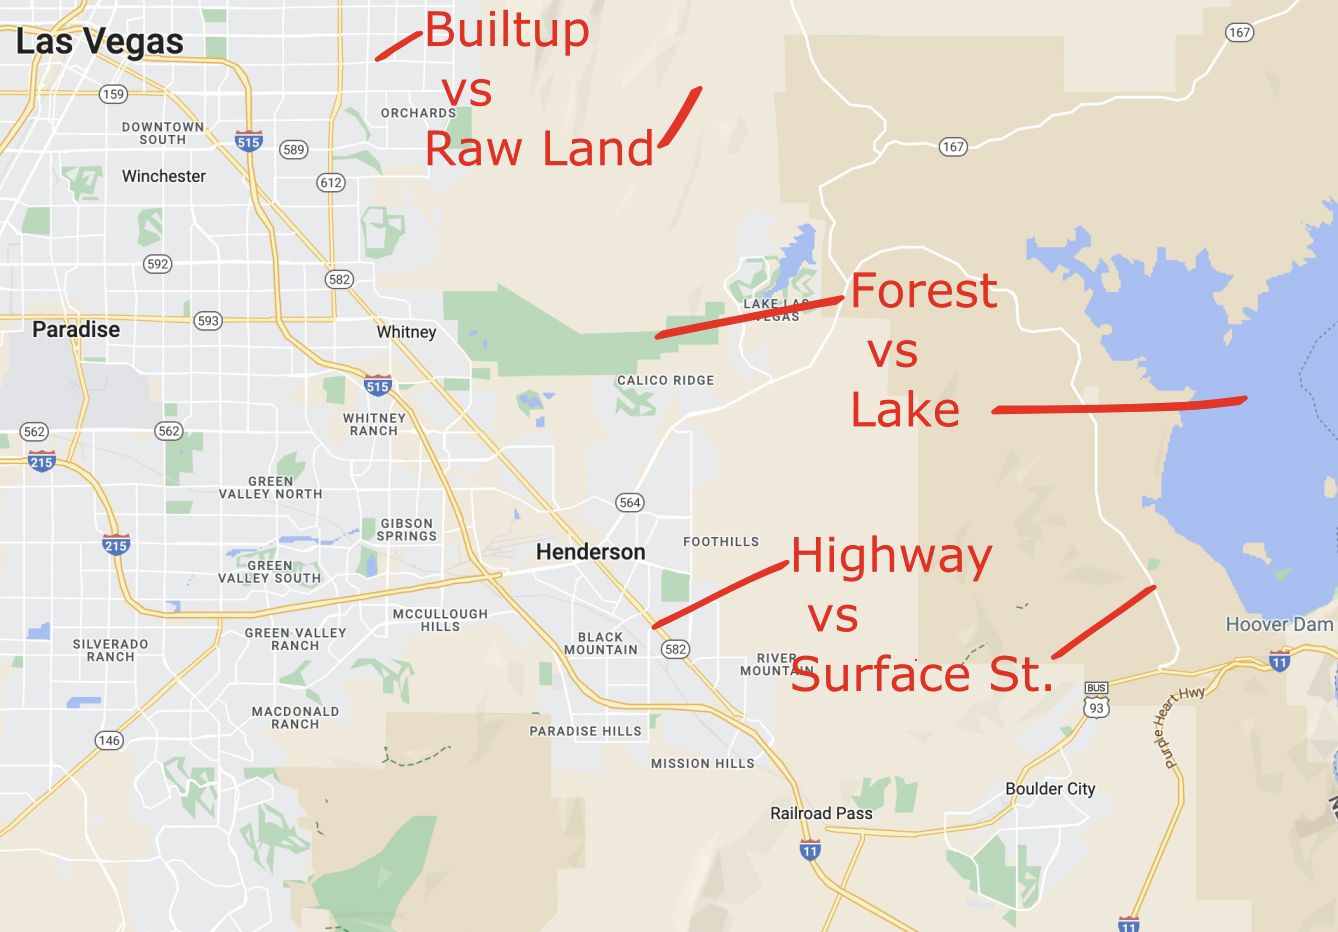
Graphical Scenes
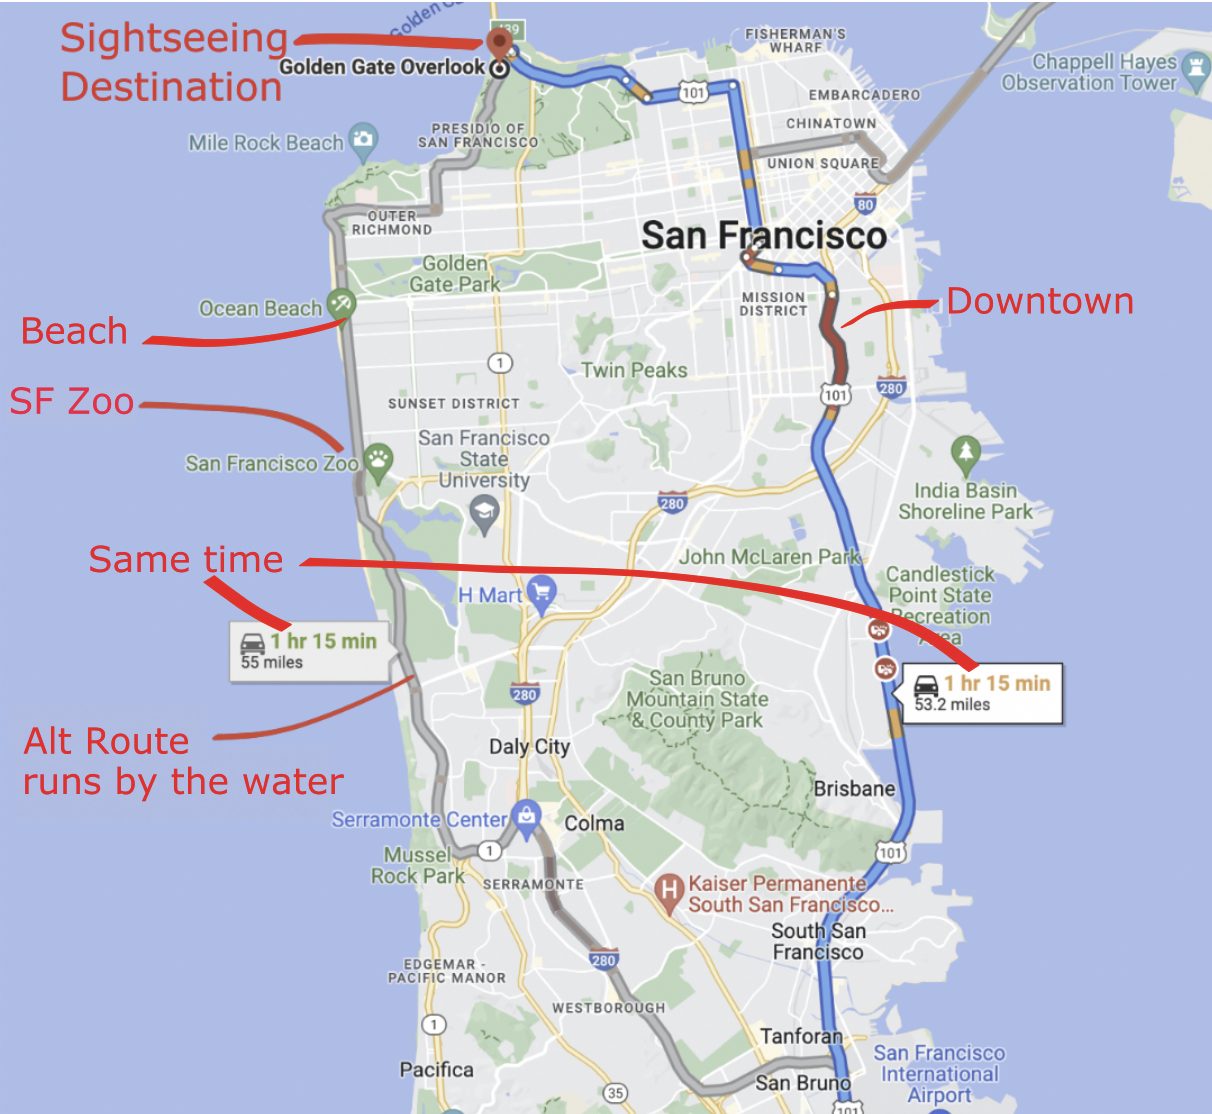
There is a wealth of information about where the target destination is, what part of the city the route passes
through, expected smoothness of the drive and traffic-jams or accidents This is at-a-glance understandability
that is missing from the textual version of the directions. Graphics are more intuitive.
Context is the presence of objects in the scene that are meaningfully placed and related to the primary
object of focus. These objects can provide additional information and meaning to the user.
Fig 3: Alternate Route. Slightly longer but same driving time. Has additional sightseeing options
Shapes
Humans process shapes tens of thousands of times quicker than text. Shapes are the chief building blocks of scenes
Fig 4: Shapes are more immediately recognized
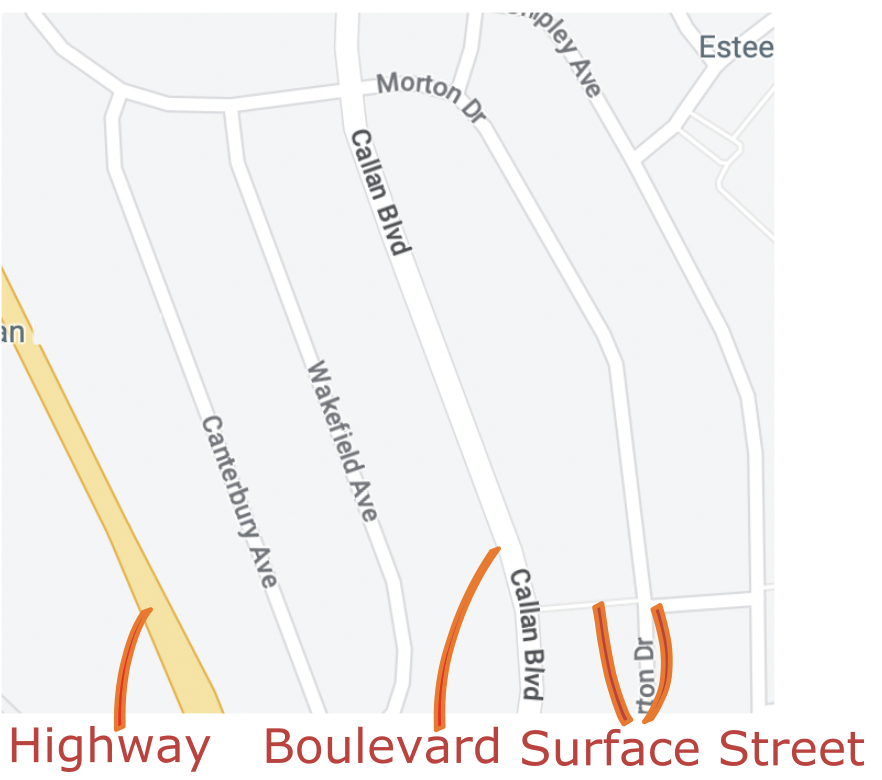
Size
Size matters, and conveys useful information.
Fig 5: EatBe eaten
Fig 6: Highway, Boulevard and Surface streets (widest to narrowest)
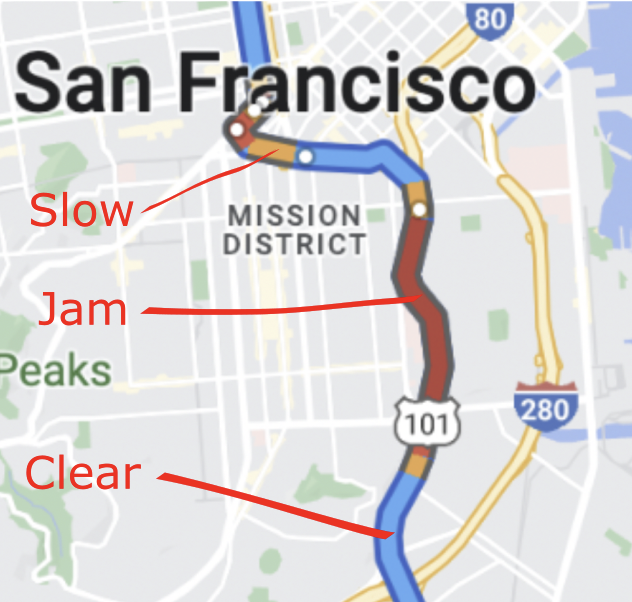
Color
Color can be a visual variable.
Fig 7: Color: Different traffic conditions
Fig 8: Color: Differentiating between map artifacts
Sense of motion / zoom & pan
The primary characteristics of zoom and pan are:
Interactivity
Progressive Shape Enhancement
Fig 9: Interactive Pan & Zoom w/Progressive Shape Enhancement
Drilldown is zooming down to an object of interest and getting additional details on it.
Fig 11: Drilldown into object of interest - Restaurant
Interconnected Views
1000words.js allows developers to create components for any domain. It is not fixed to one domain like
Google Maps and it allows different types of Scenes (or Views) to be created. These views can be connected to
each other. Zooming into an object in a parent view drops down into a child view and vice versa.
Fig 12: Interconnected Views: Main ➔ Track Incident Details ➔ Edit Targets of Track Incident
Programmatic Zoom and Pan
1000words.js makes the Zoom and Pan functionality, that is invoked by the user when interactively navigating
the scene, available in programmatic form.
This allows developers to implement application specific functions on top of that for the end user.
Fig 13: Programmatic Zoom & Pan - sample Use Case:
User clicks on a Repairs list-item in the Admin section and automatically gets taken to the actual
Compartment being repaired, in the Ffarqhuar Road train station Depot
Picture Superiority Effect
Pictures speak louder than words and are pleasant to the eyes. The contents are more immediately recognized,
recalled quicker and are retained for longer periods of time. This increases usability and user engagement.
Performance
The peformance of 1000words.js components is bounded on the upper side by the browser's
ability to render graphics on a given computer and by how much the library can get out of the way to let the browser
do its work.
For additional context, all of the smooth video captures shown below are from a modest 2022 Macbook Air.
Porting to Web Assembly can be undertaken in the unlikely event even very fast computers can't keep up with things.
Modern web apps are built using components, which make HTML more useful and reusable. Components allow
apps to be composed out of smaller pieces and are easier to maintain. 1000words.js fits into this
development methodology by allowing graphical components to be created. They have the essential characteristic
of components, that of being a black box and adhering to data in, events out communication pattern.
Once components are given data and instantiated, they are encapsulated and the only two formal methods of
communication are:
* have listeners for interesting events that happen inside the component via user interaction.
* modify domain data as needed and the component will take care of any concrete graphical manipulations.
Fig 14: Component Events
The above video shows two components that have been fed identical data by the parent App. The App has subscribed
to zoom, pan and shape-drag events of both components. When it gets an event from either one of the components, it
pipes that event data down to the other component to create a mirroring effect. The two 1000words.js compoents
are independent, encapsulated entities and unaware of each other, with all communication going through the parent
App component.
Progressive Shape Enhancement
As the user zooms in, 1000words.js automatically uses higher resolution versions of App defined shapes, to reveal
details. This is similar to how map applications work.
Fig 15: Progressive Shape Enhacement - a
Fig 16: Progressive Shape Enhacement - b
Marker Shapes
Marker Shapes are useful in two situations:
1. When the app developer decides to initially present a specific area of the scene in a less
cluttered fashion. As the user zooms in, a marker shape disappears or morphs into the actual domain objects that it
represents.
2. The other reason to use Marker Shapes is if the underlying domain object shapes are too tiny to make sense
of while the scene is zoomed out closer to the top. By the time the marker shape disappears, the domain object
shapes are bigger and the user can make better sense of the shapes.
Fig 17: Marker Shapes
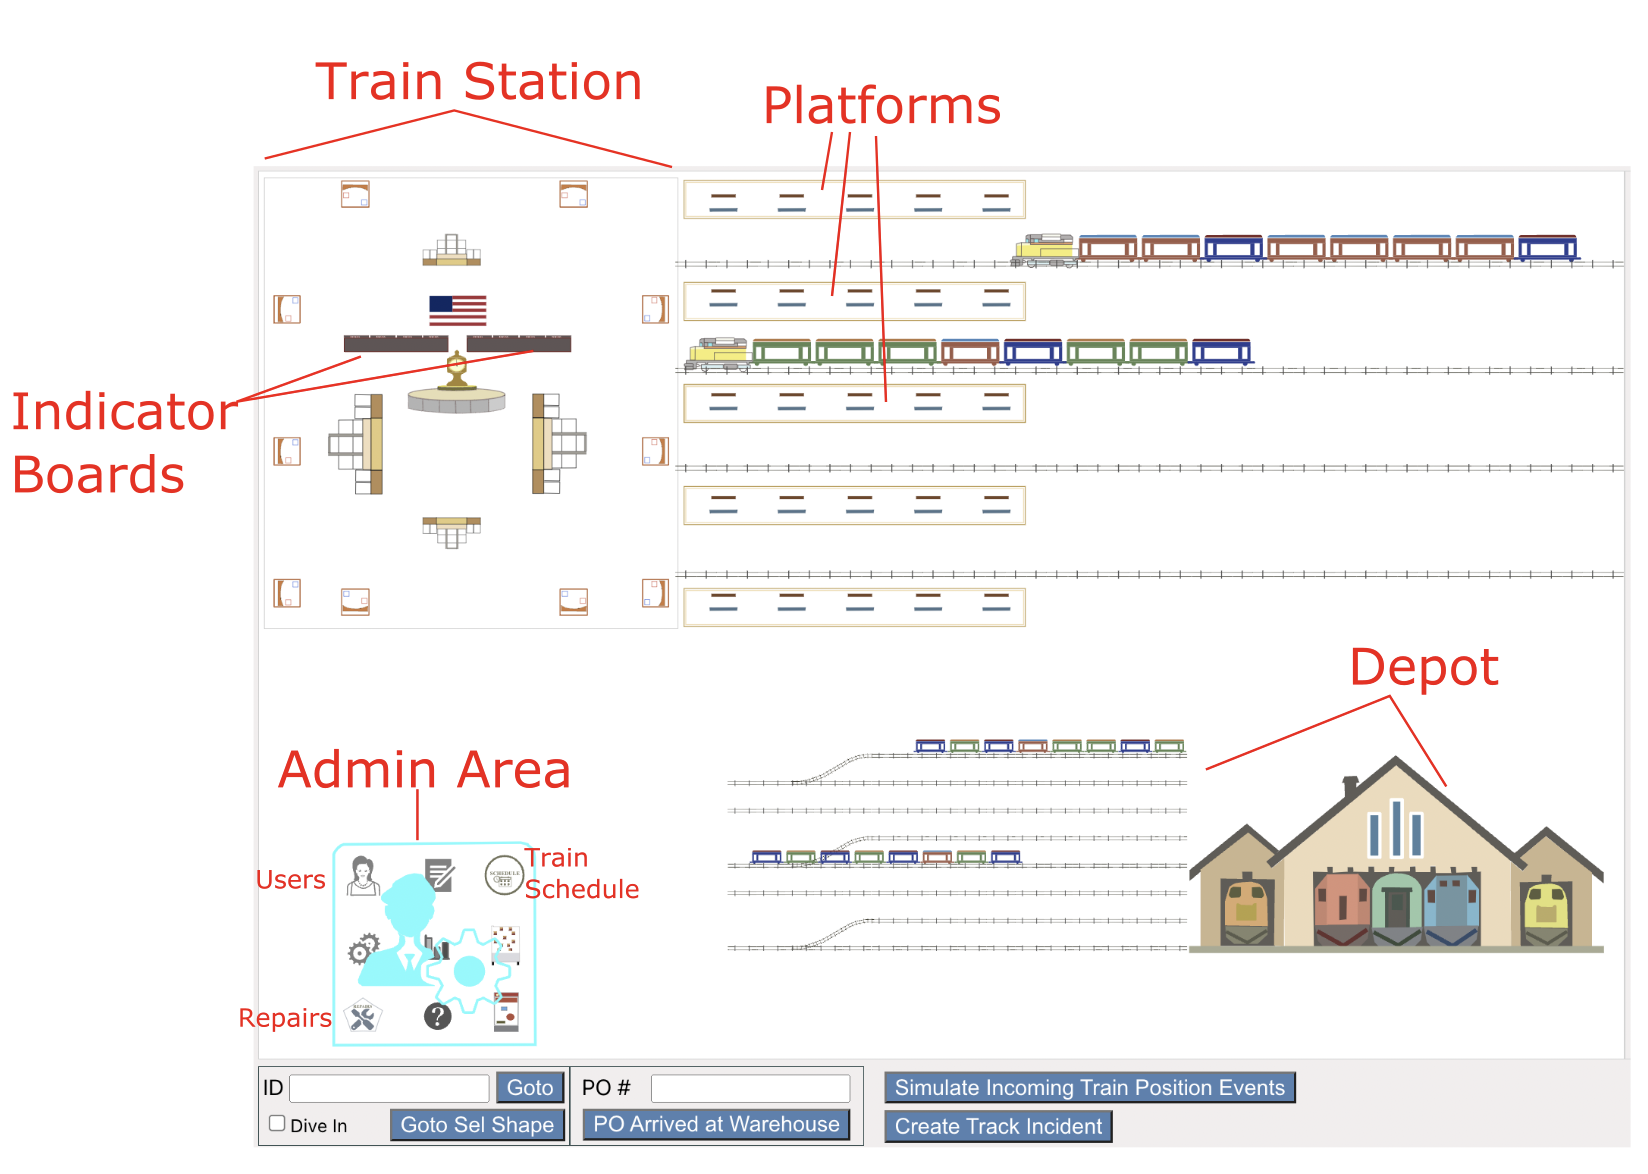
The above figure shows a scene with a train station at the top left, platforms, and a train depot on the bottom
right. There is an admin area on the bottom left with 100s of employees, train schedules and repair item details.
Those items are too small to be see clearly from up top as well as they would give the scene a very cluttered and
confusing look.
We therefore put marker shapes to indicate where thiese things are.
Fig 18: Example Marker Shapes
As the user zooms into these marker objects, they disappear to reveal their real contents.
Fig 19: Expanding Marker Shapes
Diving Into Domain Objects
Domain Objects can be marked as 'diveable' in which case the user can dive (zoom) in and be taken to another View
that shows further details of how the object is related to other objects in the system.
Note: This detailed or relationships view is "data driven". It is not a free form scene where shape positions need to
be specified. The View is automatically created from a subset of relationships that the object participates in, based
on how things are configured.
Fig 20: Diving into Domain Objects
The above video shows diving into a Track Incident. A child view with configurable details of that object
(how it is related to other domain objects) is shown (more details on this in later sections).
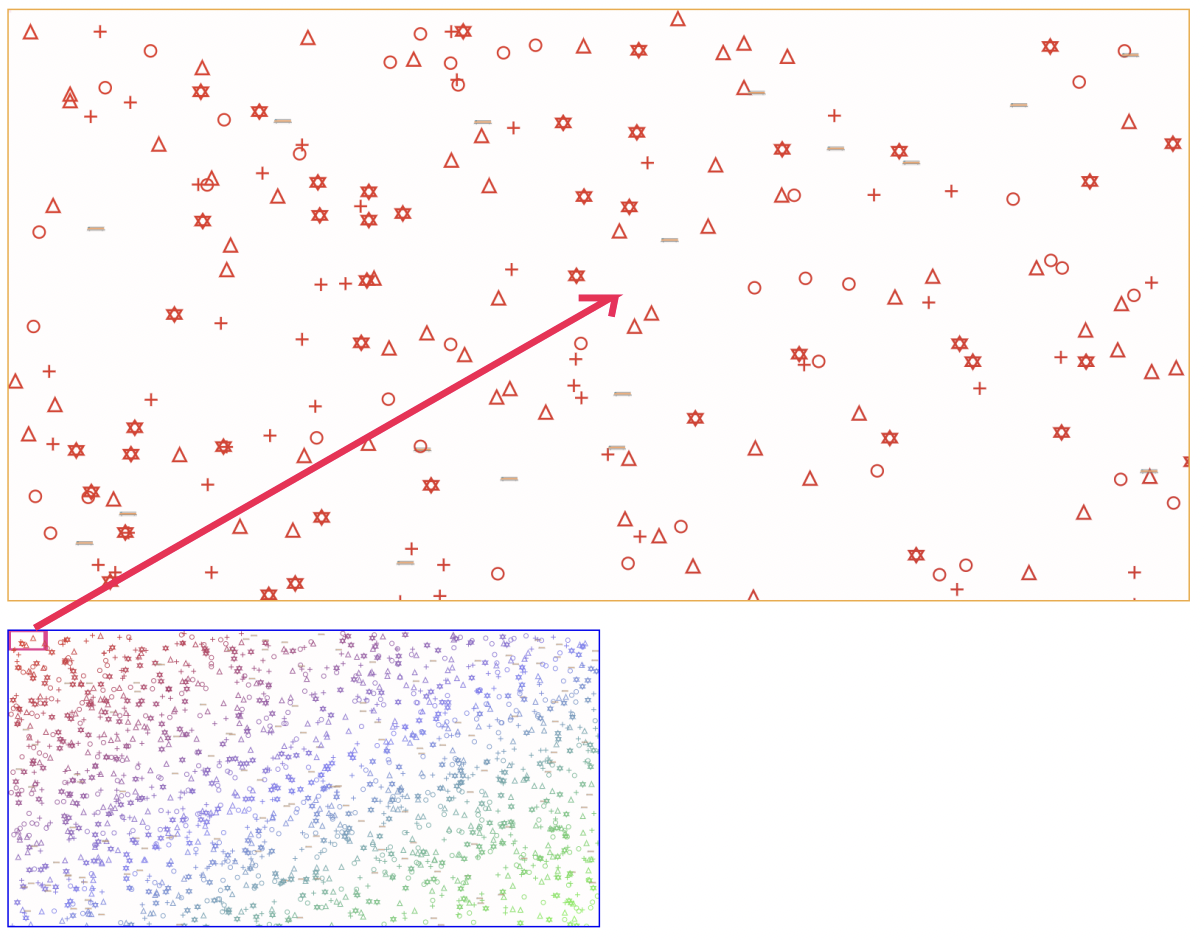
Panoramic View
As the scene broadens to encompass larger numbers of objects, some objects, depending on their size, aren't
easily discernable from up top. Simple techniques like Marker Objects can be used to address this.
For even more extreme situations, 1000words.js offers a Panoramic View capability.
Fig 21: Panoramic View Initial State
The above figure shows the panoramic view which contains just 1/256 of the area of the full
scene. The portion of the scene currently shown is indicated by the viewport indicator in the overview.
When the panoramic view is first instantiated, the focus is on the top left of the scene.
Fig 22: Zooming and Panning the Panoramic View
The above video shows user pan actions in the main view being reflected via movements of the viewport indicator in the main view.
Zooming actions are reflected as reduction or increase in the size of the viewport indicator.
Fig 23: Dragging the Viewport Indicator - Example 1
Examples 1 (above) and 2 (below): Users 1can quickly navigate to a
different part of the scene by dragging the viewport indicator around, in the overview.
Fig 24: Dragging the Viewport Indicator - Example 2
Additional Features
Programmatic Zoom and Pan
1000words.js internals that support user zoom and pan operations are modularized and packaged as
an API that can be programmatically called. This should open up imaginative use cases for applications.
The use of movement creates a dynamic and engaging experience for users that is not available in text-only
visualizations.
Instead of abruptly "jumping" to an object of interest, like is typically done, pictures allows us to
gradually "move" to the object so that the user does not lose his/her spatial orientation of the overall
scena and can see the objects in the surrounding area as the object of interest moves closer.
Fig 23: Programmatic Zoom & Pan - Ex 1 - App initiated
Ex 1: App initiated find The above figure shows an application defined concept of an "alert" on some object somewhere
on the screen. In this case, that object happens to be embedded inside a top level marker object. The application uses
1000words.js provided functions to zoom & pan to, first the marker object, and as it expands, to the actual alert.
Fig 24: Programmatic Zoom & Pan - Ex 2 - Library initiated
Ex 2: 1000words.js initiated find The above figure shows
the library uses its own functionality to do programmatic movements. There is the concept of "proxy objects" which are placeholders
for the real object somewhere on the main scene. In this case we put proxy objects for repairs that are being undertaken in various
Depots, in the admin area for a supervisor to quickly find out how many maintenance tasks on compartment chassis, wheels or windows
are currently being undertaken.
When the user selects the proxy object and clicks on the "goto" circle that shows up, the library initiates a programmatic
movement to the underlying object on the main scene.
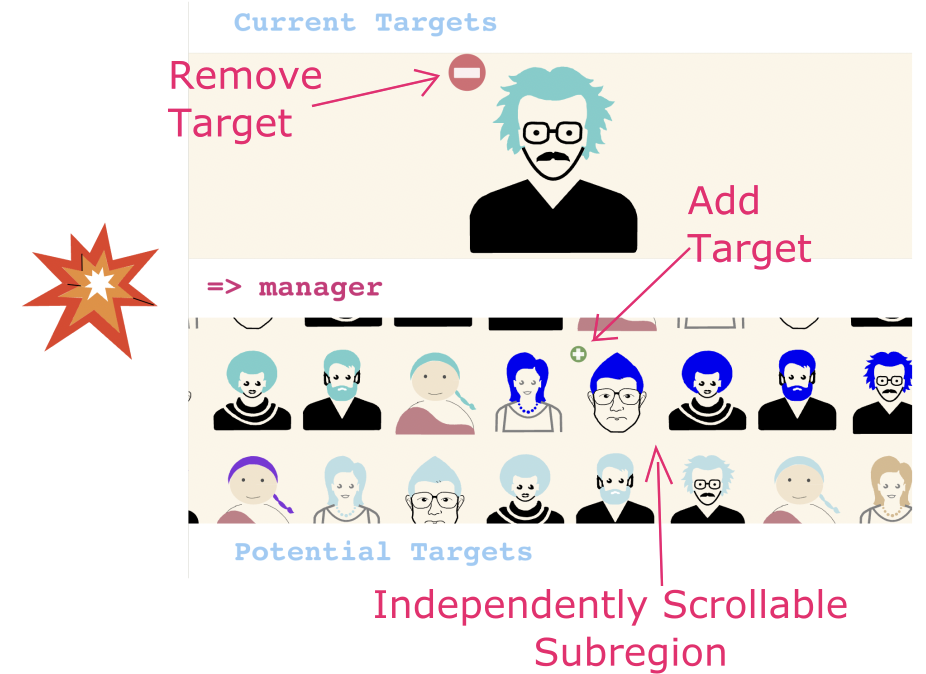
Domain Object Relationship Editing
Adding or removing targets to various relationships that objects participate in, is done via the Edit Targets View which
is entered by clicking on the Edit Icon belonging to any relationship in the Relationship Tree View.
More details on Relationship Tree View here and Edit Targets View
here.
Domain Object Attribute Editing
HTML - built in elements
HTML has an comprehensive list of form elements available such as form, input, textarea, label, fieldset, select, opgroup, option,
button, datalist and output. We have various flavors of master-detail views in HTML such as a view or list where an object
can be selected and leaf level attributes are then displayed in detailed form elements that the user can input data in.
It is both unwise and unfeasible to reimplement such form elements in pictorial format so we employ the same master-detail like
strategy to enable leaf level attribute editing. The master view is the 1000words.js view and upon select or focus of an
object, a details view can be shown for editing.
Fig 25: Editing Attributes - Built In HTML
The above video shows HTML Lists, Dropdown Lists and Buttons being used to display and input data to the Indicator Board.
HTML - custom elements
HTML custom designed inputs can be created as desired, to control the input attribute values.
Fig 26: Editing Attributes - Custom HTML
The above video shows a standard HTML input element to enter a text attribute value of the Pinkerton's Detective
Agency object and custom designed color palette to control the tie colors of individual detectives.
Editing Attributes - 1000words.js
Though HTML is the natural choice for low level data entry, we can use 1000words.js built-in Edit Targets View
and the events it emits upon target changes, to modify attributes of domain objects. The mileage of the design aesthetics
will vary depending on the situation and visual creativity so this might be an infrequent strategy at best.
Fig 27: Editing Attributes - Custom HTML
The above video shows a slightly wacky way of using 1000words.js instead of HTML to input attribute values.
The 'po' relationship of supplier 'Koppers' is edited which is like placing a new Purchase Order with that supplier.
The 'Potential Targets' section has predefined amounts of 'Ties' and depending on which of these potential targets we
[add], the 'Current Targets' has a target whose visual display shows [how many] Ties will be ordered.
API
1000words.js components are generic JavaScript and framework agnostic. Initial instantiation into empty
placeholder divs and all subsequent interactions are in plain JavaScript so the components can be incorporated
into any of the popular frameworks like React or Angular.
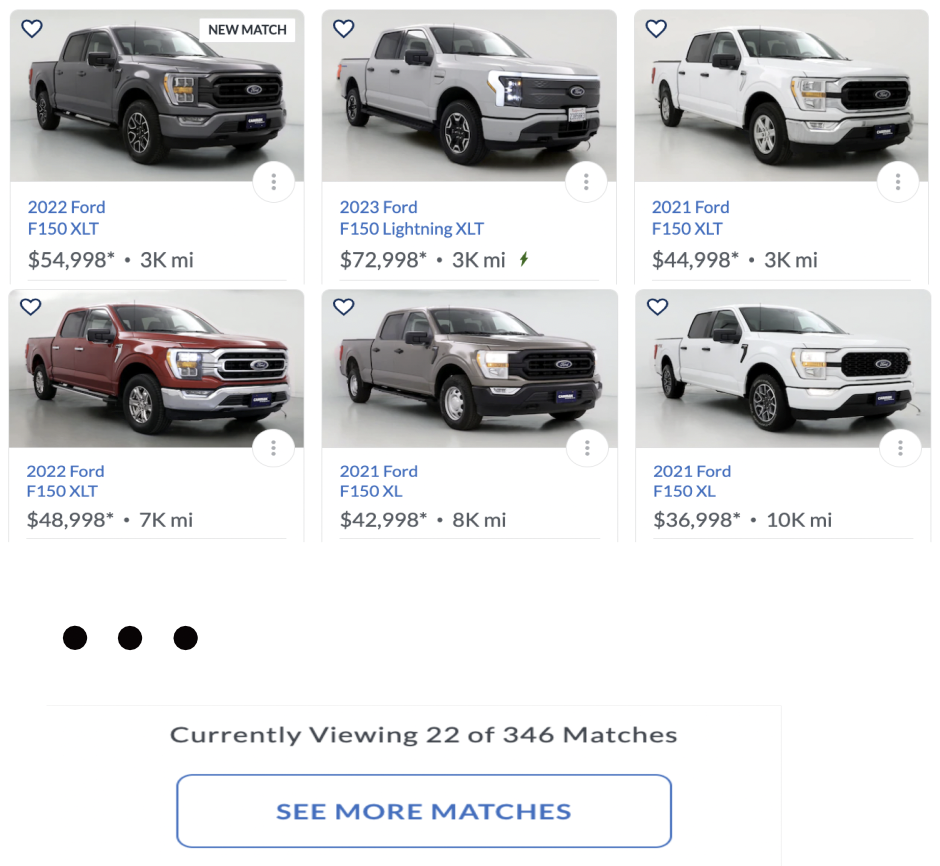
Atypical Example - Used Cars
Typically, the larger and more complex a domain, the better the likelihood that there is pain which can
be alleviated by pictures.
Browsing a list of 300+ Ford F-150s isn't that base and it would seem like a pictorial approach may
not make a huge difference. Especially when we take into account that, for this example, two important
aspects of pictures (size and shape) are not allowed to shine.
Shape - all Ford F150s have the same shape.
Size - just Ford F150s - hard to use size to convey useful information.
In spite of this, we can use this trivial example to highlight some limitations of a text only approach.
The biggish list of car can only be sorted in one dimension at a time (price low/high, mileage low/high,
trim, model year etc.) What the buyer needs is a way to look at multiple facets of the car in one view.
Fig 28: Sorted Cars - Price Low to High
Fig 29: Sorted Cars - Mileage Low to High
Problems with lists of multi-dimensional data
A possible workflow that potential buyers would go through might look as follows:
Sort by price low to high - check out a few cars.
Sort by price high to low - check out a few cars.
Similary by mileage low to high, high to low, model year etc. - check out a few cars.
Likes a couple of cars while seeing the sorted-by-model-year list and wonders "there was another car
I liked earlier, was it the 143rd car on the sorted by price low-to-high list?".
The end result could easily be 15 minutes spend going back-n-forth, through various lists and trying to decide
how cars in multiple lists compare with each other, in order to narrow down to maybe 10 cars for final selection.
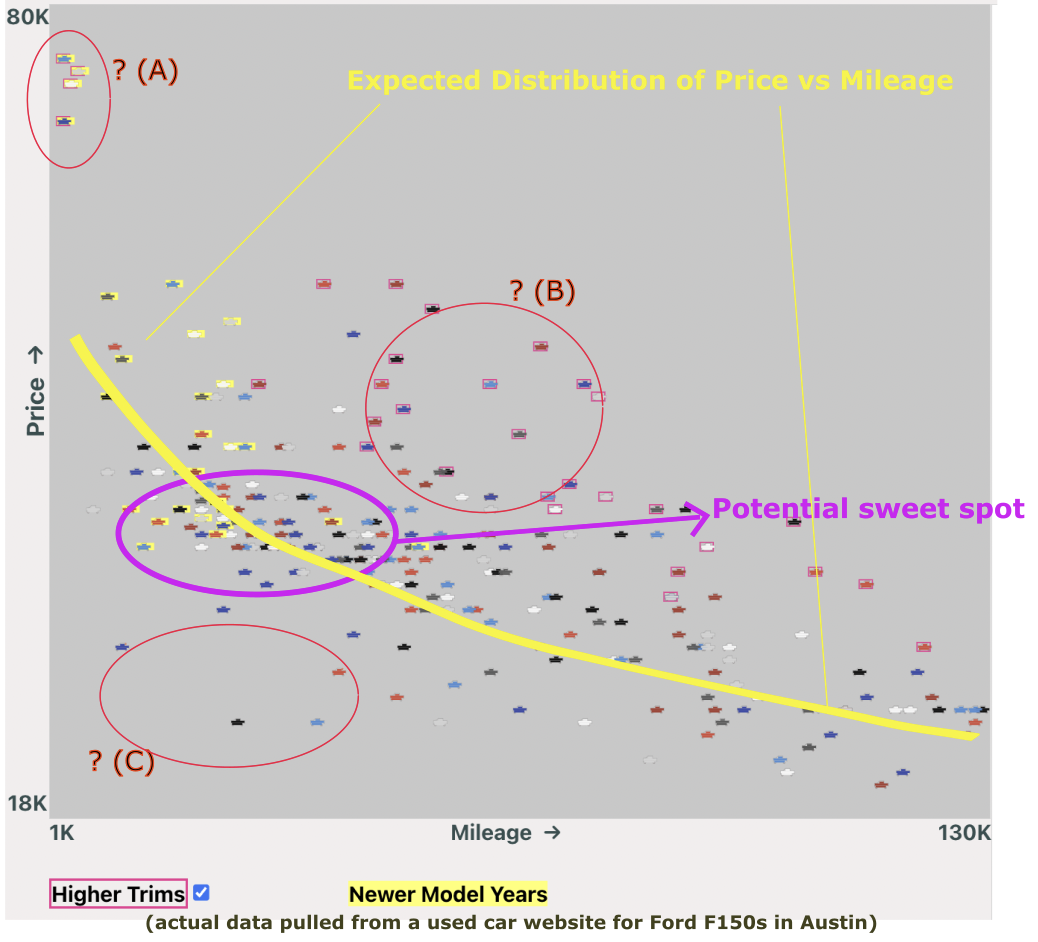
Can a picture improve upon this?
A picture allows mileage, price,
model year and trim level to be seen together in relation to each other.
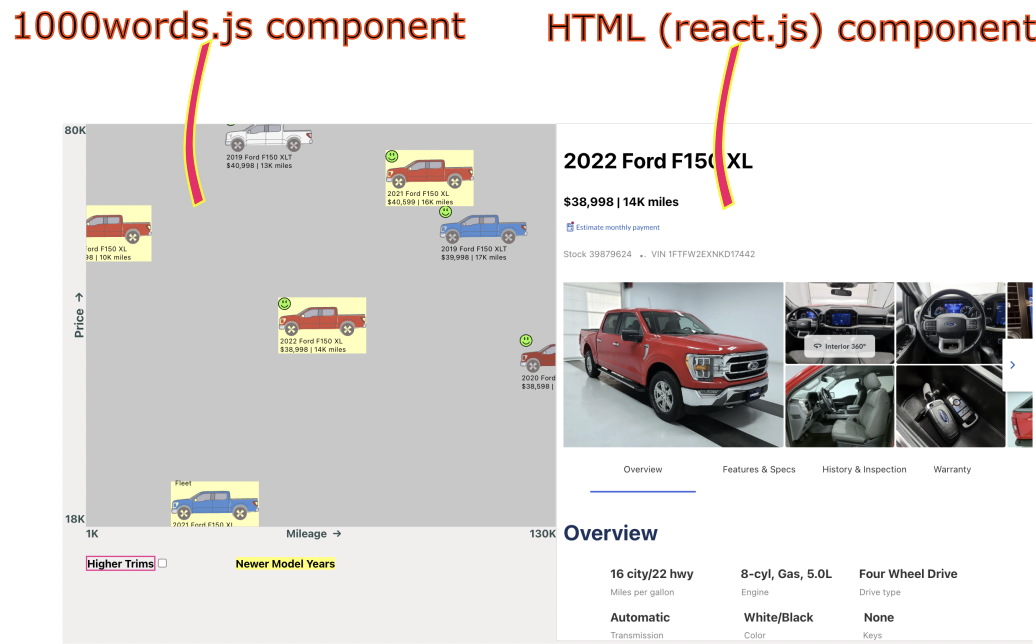
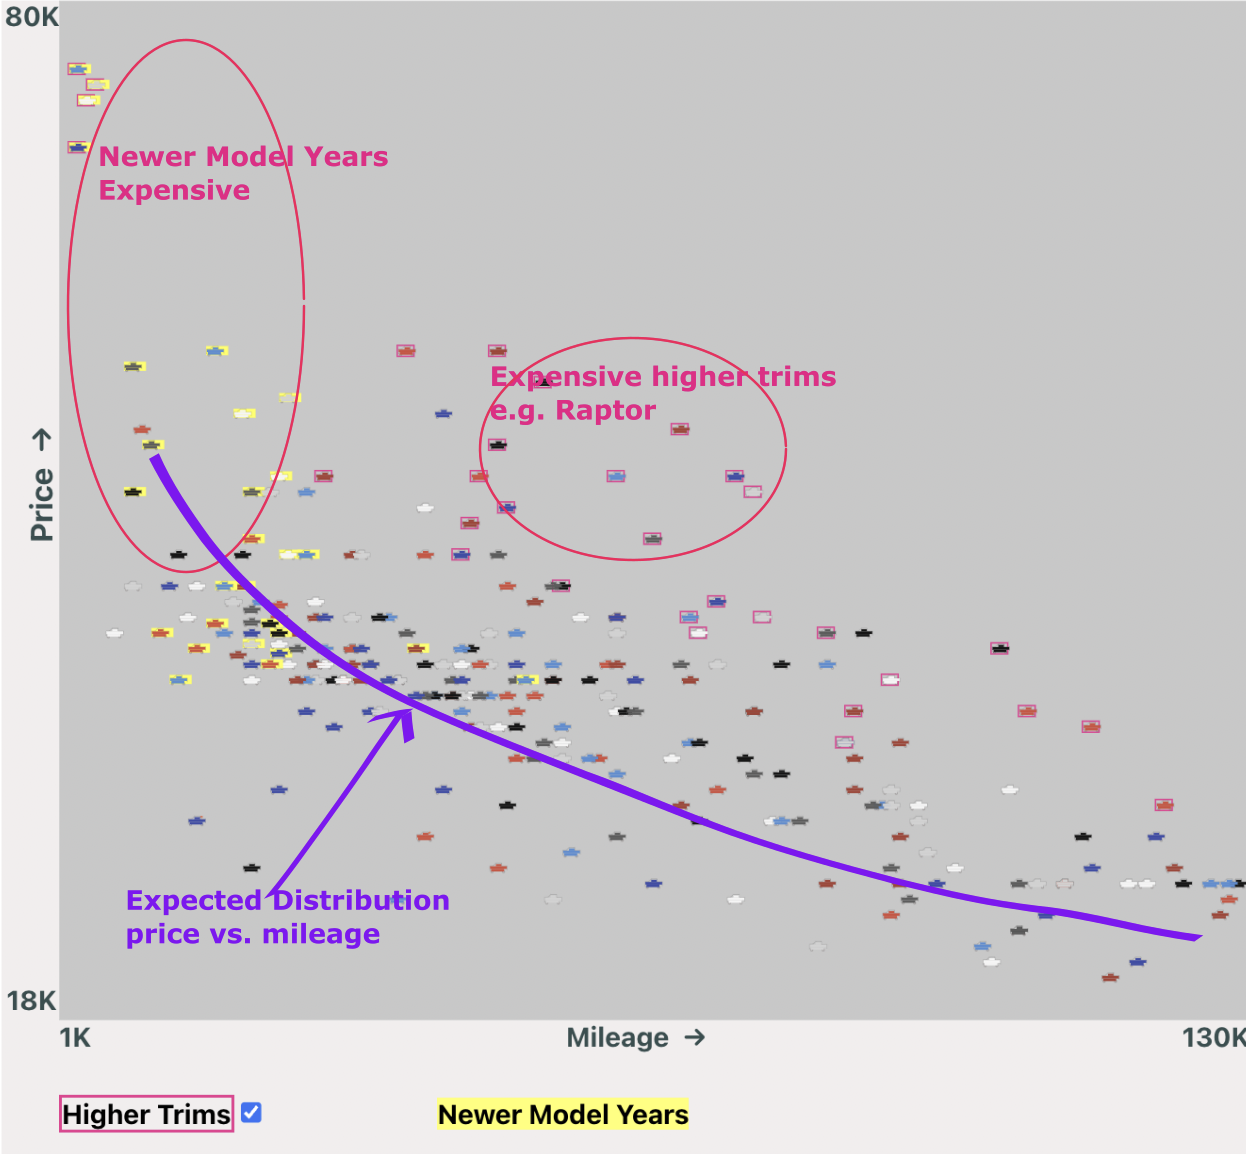
Fig 30: Collection of used Ford F150s
The above image shows actual data at one point in time, on a used car website, for used Ford F150s in the Austin area.
The yellow line shows an expected or typical distribution of cars (mileage increasing on x-axis, price on the y-axis).
Note: Higher trim cars are shown with a red rectangle border.
Note: Newer model years (< 3 yrs) shown with a yellow background.
Regions A, B and C don't seem to fit in with the yellow distribution pattern. The reasons are:
A: Ford F150 Lightnings - much more expensive EV compared to ICE cars.
B: Higher Trims (e.g. Raptor) that are expensive relative to regular trim cars with similar mileages.
C: Low mileage and low price seem to good to be true. Let's zoom in.
Fig 31: Fleet cars, cars with multiple owners and cars with accidents
A quick zoom into Region C shows that the trucks with low mileage have unrealistically low prices for reasons like
accident or
multiple owners or
they belonged to a fleet.
Browsing Car Summaries and Viewing Details
Fig 32: Browsing Cars/Viewing Details in a Target Area
Conclusions
Using a two dimensional picture approach, about eight lists (mileage low/high, price low/high, model year low/high, trim low/high)
were converted to a single picture. This would hopefully allow the car buyers to narrow down to a handful of finalists, quicker.
Panning the view allows for a fluid experience in viewing details of each car. Typically with a list based approach on used
car websites, users would click on an entry and be taken to a different page to view details and then go back to the list and
repeat.
Note: The above video shows a 1000words.js component on the left, communicating, via main App, with the HTML
component on the right.
Fig 33: 1000words.js and HTML components working together
Example - Train Station & Depot
This example shows how a large, detailed domain can be represented in a scene. It involves both browsing the scene as
well as making changes to Domain Objects.
Administration of Station and Depot
Fig 34: Station and Depot Overview
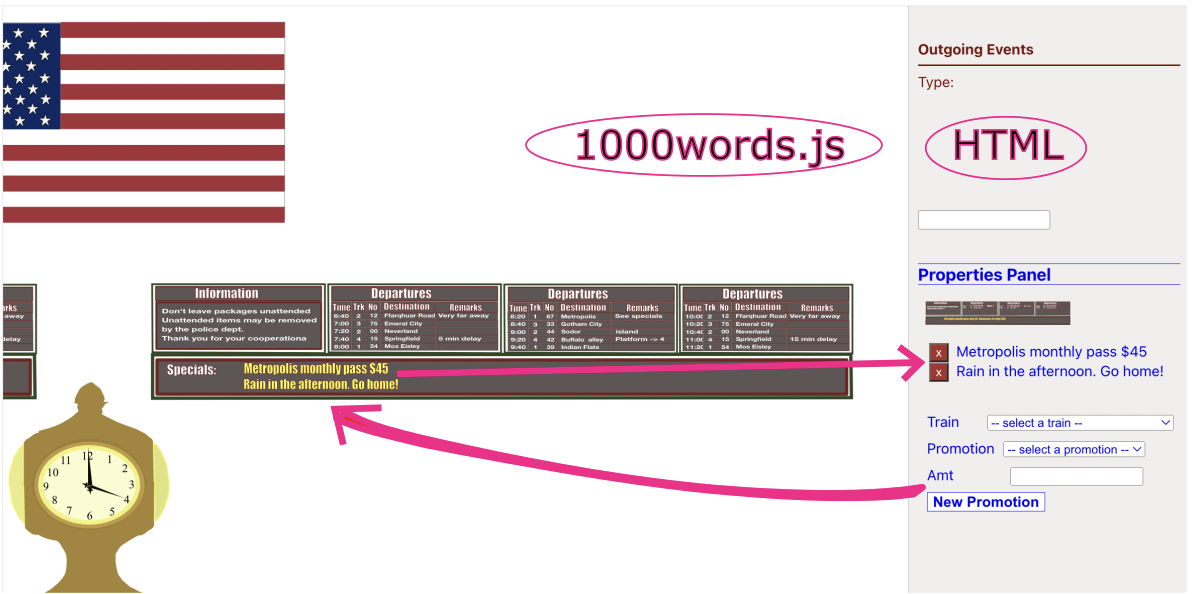
Changing the Indicator Board Contents
Dive into the Train Schedule shape in the Admin Area to reveal the schedule.
Inspect the compartment shapes to see if any trains are on the empty side (the compartment shapes have been designed
to show different number of passenger faces in the windows)
If need be, go to the Indicator Board and modify its contents to reflect any promotions for trains that are on
the emptier side.
Fig 35: Modifying the Indicator Board
Fig 36: Marker Object that reveals the Train Schedule
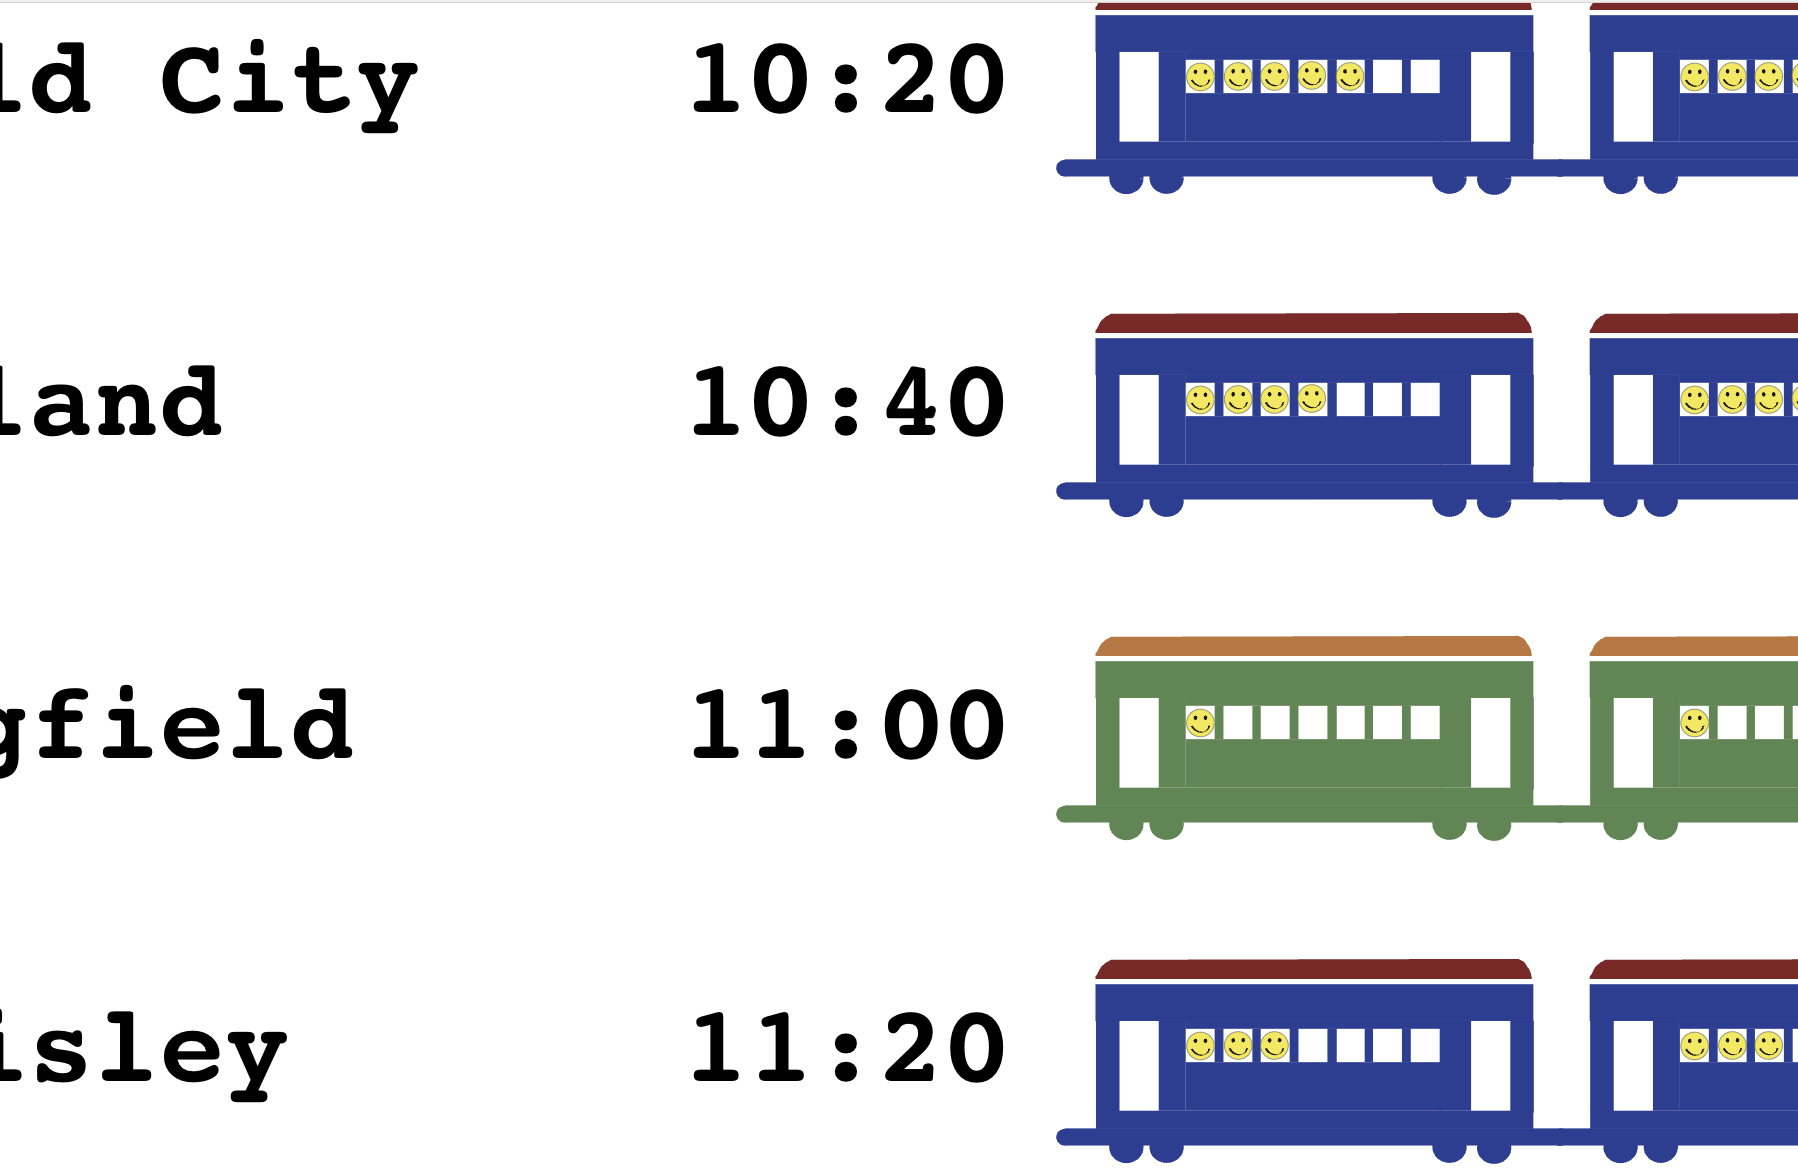
Zoom into this marker object in the Admin Section, to see the full Train Schedule.
Fig 37: Visualizing how full a train is
Upcoming Trains from quit full → somewhat empty : 10:20→10:40→11:20→11:00.
Fig 38: Indicator Board and HTML Property Panel Component
Using an HTML Component to show and edit the details of the Indicator Board.
Using Proxy Object in Admin Section to Find Underlying Repair on Main Scene
Fig 39: Programmatic Zoom & Pan Using Proxy Objects
The Admin Section can contain, among other things, a collection of items of a certain type (e.g. Vending Machines, Ticket Machines,
All Repairs, All Employees etc). Since these objects exist on the main scene (e.g. Vending Machine 374 might be at furtheset end of
Platform 3) the objects shown in the collection in the Admin Area are proxies for the real objects. The User can shift-click on the
shape to bring up the "goto" icon and click on it, to be taken to the original object, wherever it is, on the main scene.
Using Incoming Train Location Data to Update Scene
Fig 40: Updating Position of Domain Objects
Pictures allow objects to have different positions on the scene, if/as appropriate, allowing Users to get a better understanding
of their state.
1000words.js allows attributes of objects, including position, to be updated. The library then re-renders the object
to reflect the updated values.
Note: The video above has artificially speeded up incoming position events to create a quicker demonstration. In actual
applications, objects may change their position infrequently.
Diving into Track Incident Details by Zooming In
Fig 41: Diving into Track Incident by Zooming In
Relationship Tree View - Detail
This view is entered by diving into an object (see end of video in previous section). Its job is to allow relationships between
objects to be modified by adding or removing targets.
Fig 42: Interconnected Objects
Objects in larger domains will typically be inter connected to each other via many relationships. If we allow all relationships
of the primary focus object as well as all relationships of all targets to be shown in the Relationship Tree View, we will
end up editing the entire system every time we dive into any object, which is unweildy and clearly not desired.
To facilitate this, views can be configured to:
Not show some relationships (so their targets are also hidden).
Show some relationships with targets collapsed.
This is when the expectation is for the User to, occasionally, want to
see the targets and/or modify them. This reduces initial clutter in a potentially busy screen.
Show some relationships with their targets expanded.
These are the common ones that are expected to be worked on most
frequently.
For relationships that are shown with expanded targets they will, in turn, have downstream relationships
that are either
hidden - so can't be worked on
shown with collapsed targets
shown with expanded targets
Fig 43: Relationship Tree View for Track Incident
The person dealing with a Track Repair needs to:
Allocate Tracks, Ties and Ballast from the warehouse so the repair can be completed.
If there isn't enough of something, a order needs to be placed. When that order arrives at the warehouse, it needs to be
allocated for the repair.
Assign a manager to oversee the physical fixes, if one isn't already assigned.
Track individual status of Tracks/Ties/Ballast as they go from Available(in Warehouse) to Allocated to Delivered (at repair site)
Track Overall Status
Allocating Ballast
This involves editing the "allocated" relationship. We can see that there are currently no targets because the targets
of that relationship are already expanded (there is a collapse icon on it).
Editing is done by clicking on the edit button
which brings up the Edit Targets View
Fig 44: Allocating Ballast for Repair
Edit Targets View
This view is entered when the 'Edit' icon on Relationship Tree View
Fig 45: Adding & Removing Targets
Fig 46: Edit Targets View - Regions
Fig 47: Edit Targets View - Usage
Ordering and Allocating Ties
Fig 48: Ordering & Allocating Ties
The above video shows the following sequence of things:
Click on the Edit Icon of the 'allocated' relationship of Ties (overall status currently at 2/10).
Notice that there are no available targets (warehouse is empty). Jump back out to Relationship Tree View. Time to place
an order with the supplier.
Expand the 'supplier' relationship and edit the 'po' relationship.
Add the placeholder targets '2' and '1' to that relationship. When the user finishes tweaking the targets and goes
back to the Relationship Tree View, 1000words.js will send and event out to the App indicating that targets
of that relationship changed, along with details (Shape: 'Koppers', RelName 'po', Qty: 3)
We simulate an event going out to an external system and simulate an incoming event when the goods show up at the
warehouse by clicking the "PO Arrived at Warehouse" button with the po number.
Now when we edit the 'allocated' relationship again, we see 3 bundles of Ties and finish allocating one.
As we go back to the main Relationship Tree View, we see that the individual status for 'Ties' has progressed around
the blue circle and the overall status has progressed to 4/10.
Miscellaneous
Illustrations vs. Realistic Pictures
Google Maps is a browser based application custom designed for one specific domain and uses canvas to implement its graphics.
As we can see the graphics depicting roads, water, parks and businesses are illustrative and not photorealistic. Similarly,
1000words.js requires illustrative shapes to be able to display many of them with smooth performance.
Note: The specific domain addressed by the application and its complexity will determine exactly what shapes give users
a good understanding while still maintaining smoothness. Below are various images that give an approximate feel for this.
Fig 49: Very Simplified shape - maybe okay when seeing from afar
Fig 50: Simple shape that conveys the idea
Fig 51: More detail is shown and may be suitable for close ups
Fig 52: No
Picturizing Domain Characteristics
While Google Maps show a domain that has 'position' and 'direction' as intrinsic properties, many web apps deal with
technical details. Pictures can be used, with some creativity, to visualize these domains and make them more accessible to users.
Example 1 - Used Cars: Please see the section on
Problems with lists of multi-dimensional data to get an idea of why users take longer and have an unintuitive
experience of narrowing down to a favorite list of, say, 10 cars to look in detail.
One way to improve this experience is to convert two main characteristics of used cars, price and mileage, into a
two dimensional graph that allows for an important property of pictures, relative position, to shine.
Users now has a at-a-glance look at how price goes down as mileage goes up and they can compare cars positioned in one
region of the picture.
Other properties of graphics, such as shape and texture, are also used to show newer model years (not necessarily the same as
lower mileage) with a yellow background and higher trim cars (which tend to be more expensive even with additional miles on them)
with red border.
Fig 53: Picturizing a list of ~300 used cars
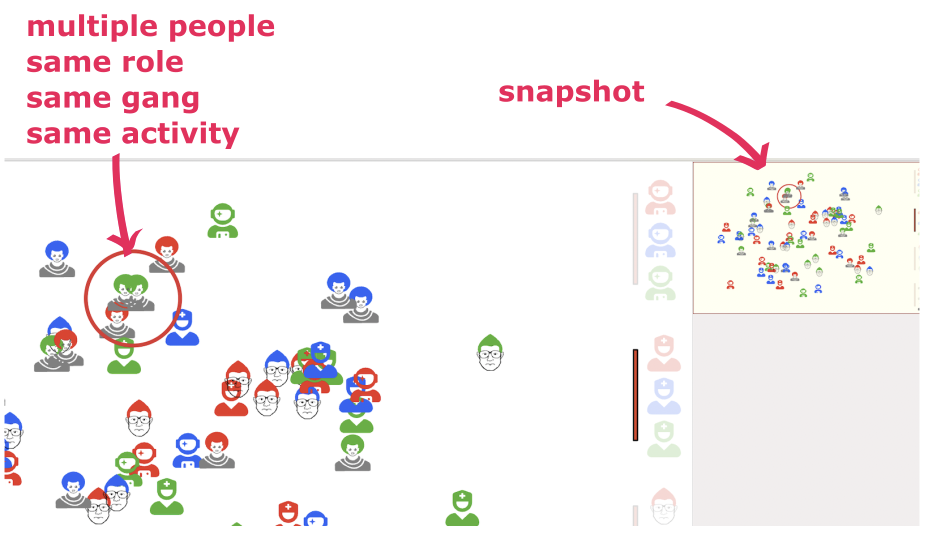
Example 2 - Monitoring Gang Activity and creating Snapshots: There are many variables to monitor simultaneously and visualizing this
textually would be cluttered and confusing. The problem consists of monitoring multiple gangs with members playing
different roles (underboss, captain, soldiers, falcons, mules) doing either nothing or activities that might be include
robbery, assault, drug distribution, school activity, recruiting parties etc.
The following visualizations are employed:
Different, overlapping regions of the scene are designated for various activities, based on observations that come into the
system.
Different gangs have different colors
Different roles have different shapes
Same roles in different gangs participating in the same activity in the city are considered 'inter gang collaboration'
and shown with this visual
Multip people with the same role from the same gang, observed in the same activity is considered as worthy of recording
(capturing snapshot) and follow-up.
Note on Snapshots: This is not a built in capability of 1000words.js and shows how easy it is, to create nice
custom visualization with very little code. 1000words.js views get created in empty divs with some data with one line
of code, so the snapshots are merely standard web app stuff (react.js in this case) that takes the data as it exists when the
pattern match is observed and creates new 1000wordws.js views as needed.
Below is an animation (speeded up for demo purposes) that simulate activity transitions of various gangs.
Fig 54: Visualizing and Capturing Gang Activity
Diving In & Jumping Out of Views
The act of Diving In is a natural extension of zooming in. Zoom in performed by swiping the
trackpad or using scroll wheel. Once the user is close to some object, they can simply continue to zoom in to finish
the diving process. It is very fast and intuitive.
Jumping Out could be the reverse process i.e. zoom out, but there is an issue with that. When
a user is inside a child view, they can, and often will, zoom in further as they navigate the child view. Now when they
zoom out, they may simply want to go to the top of the child view. It can get irritating if they get thrown out to the
parent view when they simply want to zoom to the top of the child view. A feature of trackpad or scroll wheels is that
if the scroll action is done with any force, the scroll events continue to roll into the browser after the user lifts
their hand.
To avoid this, a positive, non default gesture is required. It is to swipe in order to zoom out, then move the cursor
by any tiny amount in any direction and then swipe again.
Now if the user simply wants to go to the top of the child view and swipes forcefully, the view will go to the top and
stay there. If the user intends to jump out, they have to do a swipe, tiniest movement of the cursor, swipe again. It
is hard to describe in words but it is still a fluid gesture that take about 1.5 seconds, and is easy to get used to.